15
REFLECTIONS
CONSIDER THE FIRST QUADRANT point (a, b), and let us reflect it about the y-axis. It is reflected to the second quadrant point (−a, b).
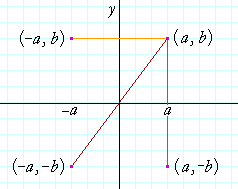
If we reflect (a, b) about the x-axis, then it is reflected to the fourth quadrant point (a, −b).
Finally, if we reflect (a, b) through the origin, then it is reflected to the third quadrant point (−a, −b). The distance from the origin to (a, b) is equal to the distance from the origin to (−a, −b).
Example 1.
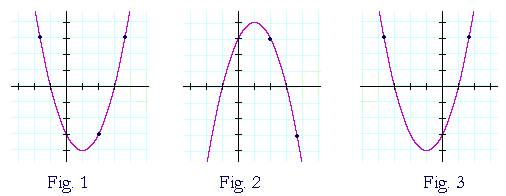
Fig. 1 is the graph of this parabola:
f(x) = x2 − 2x − 3 = (x + 1)(x − 3).
The roots −1, 3 are the x-intercepts.
Fig. 2 is its reflection about the x-axis. Every point that was above the x-axis gets reflected to below the x-axis. And every point below the x-axis gets reflected above the x-axis. Only the roots, −1 and 3, are invariant.
Again, Fig. 1 is y = f(x). Its reflection about the x-axis is y = −f(x). Every y-value is the negative of the original f(x).

Fig. 3 is the reflection of Fig. 1 about the y-axis. Every point that was to the right of the origin gets reflected to the left. And every point that was on the left gets reflected to the right. In other words: Every x becomes −x. Only the y-intercept is invariant.
The equation of Fig. 3 is y = f(−x). The argument x of f(x) is replaced by −x. See Problem 1c) below.
If y = f(x), then
y = f(−x) is its reflection about the y-axis,
y = −f(x) is its reflection about the x-axis.
Problem 1. Let f(x) = x2 + x − 2.
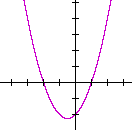
a) Sketch the graph of f(x).
To see the answer, pass your mouse over the colored area.
To cover the answer again, click "Refresh" ("Reload").
x2 + x − 2 = (x + 2)(x − 1). The x-intercepts are at −2 and 1.
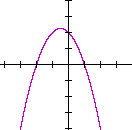
b) Write the function −f(x), and sketch its graph.
−f(x) = −(x2 + x − 2) = −x2 − x + 2. Its graph is the reflection of f(x) about the x-axis.
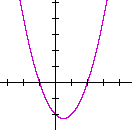
c) Write the function f(−x), and sketch its graph.
Replace each x with −x. f(−x) = (−x)2 − x − 2 = x2 − x − 2 = (x − 2)(x + 1). Its graph is the reflection of f(x) about the y-axis.
Problem 2. Let f(x) = (x + 3)(x + 1)(x − 2).
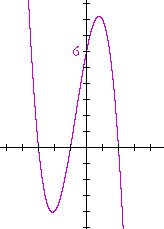
Sketch the graph of f(x), then sketch the graphs of f(−x) and −f(x).
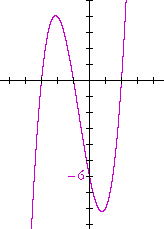
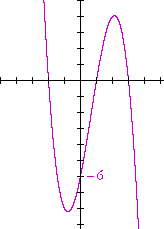
The graph on the left is f(x). The roots -- the x-intercepts -- are −3, −1, 2.
The middle graph is f(−x), which is its reflection about the y-axis.
The graph on the right is −f(x), which is its reflection about the x-axis.
Problem 3. Let f(x) = x2 − 4.
Sketch the graph of f(x), then sketch the graph of f(−x).
x2 − 4 = (x + 2)(x − 2).
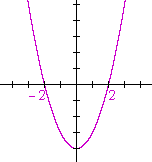
Here, the graph of f(−x) -- its reflection about the y-axis -- is equal to the graph of f(x).
Problem 4. Let f(x) = x3.
Sketch the graph of f(x), then sketch the graphs of f(−x) and −f(x).
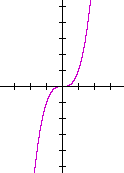
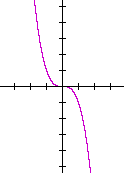
The graph on the left is f(x).
The graph on the right is f(−x), which is its reflection about the y-axis . But (−x )3 = −x3, so that
f(−x) is equal to −f(x) -- which is its reflection about the x-axis!
Example 2. Sketch the graph of
y = −x2 + x + 6.
Solution. It is best to consider a graph when the leading coefficient is positive. Therefore, let us call the given function −f(x):
| −f(x) | = | −x2 + x + 6 |
| = | −(x2 − x − 6) | |
| = | −(x + 2)(x − 3) | |
f(x), then, is (x + 2)(x − 3). Its x-intercepts are at −2 and 3. The graph we want is −f(x), which is the reflection of f(x) about the x-axis:
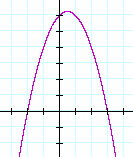
Problem 5. Sketch the graph of
y = −x2 − 2x + 8.
| −f(x) | = | −x2 − 2x + 8 |
| = | −(x2 + 2x − 8) | |
| = | −(x + 4)(x − 2) | |
Here is the graph:
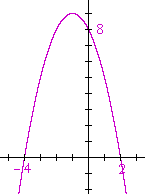
It is the reflection about the x-axis of
f(x) = x2 + 2x − 8
Problem 6. Sketch the graph of
y = −x3 − 2x2 + x + 2.
[Hint: Call the function −f(x), then factor f(x) by grouping.]
| −f(x) | = | −x3 − 2x2 + x + 2 |
| = | −(x3 + 2x2 − x − 2) | |
| = | −[x2(x + 2) − (x + 2)] | |
| = | −(x2 − 1)(x + 2) | |
| = | −(x + 1)(x − 1)(x + 2) | |
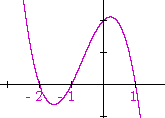
The graph is the reflection about the x-axis of
f(x) = (x + 2)(x + 1)(x − 1)
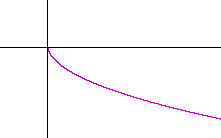
Problem 7. Sketch the graph of y = −![]() .
.
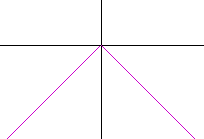
Problem 8. Sketch the graph of y = −|x|.
Please make a donation to keep TheMathPage online.
Even $1 will help.
Copyright © 2021 Lawrence Spector
Questions or comments?
E-mail: teacher@themathpage.com

