
18
Graphs of the trigonometric functions
LET US BEGINwith some algebraic language. When we write "nπ," where n could be any integer, we mean "any multiple of π."
0, ±π, ±2π, ±3π, . . .
By the zeros of sin θ we mean those values of θ for which sin θ will equal 0.
Now, where are the zeros of sin θ?
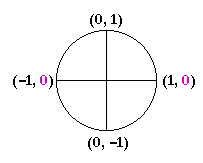
We saw in Topic 15 on the unit circle that the value of sin θ is equal to the y-coordinate. Hence, sin θ = 0 at θ = 0 and θ = π -- and at all angles coterminal with them. In other words,
(1) . . . . . . . . . sin θ = 0 when θ = nπ

They will be the x-intercepts of the graph of the sine.
Line (1) will be true, moreover, for any argument θ. For example,
sin 2x = 0 when 2x = nπ;
that is, when
| x | = | nπ 2 |
. |
| Which numbers are these? The multiples of | π 2 |
: |
| 0, ± | π 2 |
, ±π, ± | 3π 2 |
, . . . |
Problem 1. Where are the zeros of y =sin 3x?
At 3x = nπ; that is, at
| x = | nπ 3 |
. |
Which numbers are these?
| The multiples of | π 3 |
. |
The period of a function
When the values of a function regularly repeat themselves, we say that the function is periodic. The values of sin θ regularly repeat themselves every 2π units.
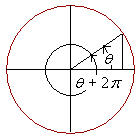
sin (θ + 2π) = sin θ.
sin θ therefore is periodic. Its period is 2π. (See the previous topic, Line values.)
Definition. If, for all values of x, the value of a function at x + p
is equal to the value at x --
If f(x + p) = f(x)
-- then we say that the function is periodic and has period p.
The graph of y = sin x
The zeros of y = sin x are at the multiples of π. It is there that the graph crosses the x-axis, because there y = 0. And its period is 2π. But what is the maximum value of the graph and what is its minimum value?
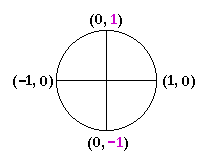
sin x has a maximum value of 1 at ![]() , and a minimum of −1 at
, and a minimum of −1 at ![]() —and at all angles coterminal with them.
—and at all angles coterminal with them.
Here is the graph of y = sin x:
The independent variable x is the radian measure. x may be any real number.

We may imagine the unit circle rolled out, in both directions, along the x-axis. (See Topic 15: The unit circle.)
Problem 2. Vocabulary.
a) In the function y = sin x, what is its domain?
−![]() < x <
< x < ![]() .
.
b) What is the range of y = sin x?
−1 ≤ sin x ≤ 1.
The graph of y = cos x

The graph of y = cos x is the graph of y = sin x translated ![]() units to the left. It is sin (x +
units to the left. It is sin (x + ![]() ). And
sin (x +
). And
sin (x + ![]() ) = cos x. The student familiar with the sum formula can easily prove that. (Topic 20.)
) = cos x. The student familiar with the sum formula can easily prove that. (Topic 20.)
On the other hand, it is possible to see directly that
![]()
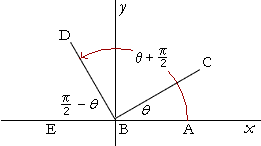
![]()
Topic 16. Angle CBD is a right angle.
The graph of y = sin ax
Since the graph of y = sin x has period 2π, then the constant a in
y = sin ax
indicates the number of periods in an interval of length 2π. (In y = sin x, a = 1.)
For example, if a = 2 --
y = sin 2x
-- that means there are 2 periods in an interval of length 2π.

If a = 3 --
y = sin 3x
-- there are 3 periods in that interval:

While if a = ½ --
y = sin ½x
-- there is only half a period in that interval:

The constant a thus signifies how frequently the function oscillates; so many radians per unit of x.
(When the independent variable is the time t, as it often is in physics, then the constant is written as ω ("omega"): sin ωt. ω is called the angular frequency; so many radians per second.)
Problem 3.
a) For which values of x are the zeros of y = sin mx?
| At mx = nπ; that is, at x = | nπ m |
. |
b) What is the period of y = sin mx?
| 2π m |
. Since there are m periods in 2π, then one period |
is 2π divided by m.
Compare the graphs above.
Problem 4. y = sin 2x.
a) What does the 2 indicate?
In an interval of length 2π, there are 2 periods.
b) What is the period of that function?
| 2π 2 |
= π |
c) Where are its zeros?
| At x = | nπ 2 |
. |
Problem 5. y = sin 6x.
a) What does the 6 indicate?
In an interval of length 2π, there are 6 periods.
b) What is the period of that function?
| 2π 6 |
= | π 3 |
c) Where are its zeros?
| At x = | nπ 6 |
. |
Problem 6. y = sin ¼x.
a) What does ¼ indicate?
In an interval of length 2π, there is one fourth of a period.
b) What is the period of that function?
2π/¼ = 2π· 4 = 8π.
c) Where are its zeros?
| At x = | nπ ¼ |
= 4nπ. |
The graph of y = tan x
Here is one period of the graph of y = tan x:
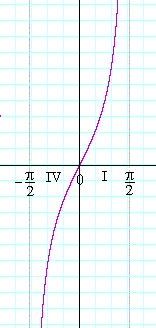
Why is that the graph? It has effectively been explained in the previous topic, where we considered the line value DE of tan x in quadrants IV and I.
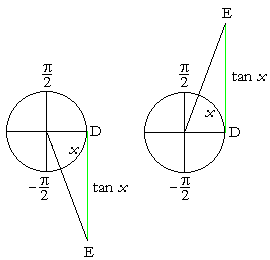
In quadrant IV, tan x -- the line value DE -- is negative and takes on all possible negative values:
−∞ < tan x < 0.
At x = 0, tan x = 0.
And finally in quadrant I, tan x takes on all positive values:
0 < tan x < ∞.
And so in the interval from −![]() to
to ![]() , tan x takes on all its possible values. That interval constitutes a complete period of y = tan x.
, tan x takes on all its possible values. That interval constitutes a complete period of y = tan x.
Here again is the graph.

At the quadrantal angles −![]() and
and ![]() , tan x has no value. Therefore the lines x = −
, tan x has no value. Therefore the lines x = −![]() and x =
and x = ![]() are vertical asymptotes.
are vertical asymptotes.
Here is the complete graph of y = tan x.
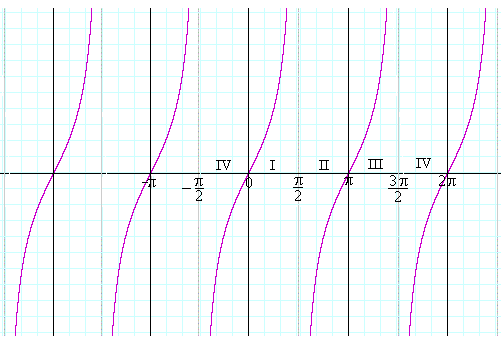
The graph of Quadrants IV and I is repeated in Quadrant II (where tan x is negative) and quadrant III (where tan x is positive), and periodically along the entire x-axis.
Problem 7. What is the period of y = tan x?
| One period is from − | π 2 |
to | π 2 |
. Hence the period is the |
distance between those two points: π.
Next Topic: Inverse trigonometric functions
Copyright © 2022 Lawrence Spector
Questions or comments?
E-mail: teacher@themathpage.com
